RECOMMENDED BUDGET FOR ICON TRADING: 750K
Icon Trading, often known as Fluctuation Trading, is not as “challenging” as it might seem.
In simple terms, it involves buying at a “Low Point” in the price fluctuation and selling at its “High Point“. Usually, “Low Points” occur during peak hours, while “High Points” happen during non-peak hours.
In this Trading Guide, we’ll explain how this method works in detail.

Understanding “Peak” and “Non-Peak” Hours:
‣ Peak Hours: These are the times when the highest number of users are actively playing Ultimate Team. Generally, Peak Hours fall between 4pm – 8pm UK Time.
‣ Non-Peak Hours: These are the times when fewer users are online and the game is less crowded. Non-Peak Hours typically begin after 8pm, extending into the late evening UK Time.
It’s worth noting that Ultimate Team is most active from Wednesday to Sunday, with Friday and Saturday being particularly the busiest days. This information is crucial for planning your trading activities effectively!
HOW TO UNDERSTAND & ANALYZE A FLUCTUATION WITH ICONS
There are 2 main methods for how you can do this:
‣ Method 1: Refer to FUTBIN / FUTWIZ Daily and Hourly Graphs (This method requires a lot of regular checks and is a much slower process)
‣ Method 2: Use our Multi-Platform Website prices which can be found inside of our Subscriber Areas (This is the easiest and most time-efficient method)
Using Method 1 is a lot more time-consuming and provides you with data that can be seen by all FIFA users who visit these public websites for pricing history. This means you are competing with every other player/trader on Ultimate Team who is using the same source to gain their knowledge of Pricing History for that Icon.
If you use Method 2, you will be viewing regularly updated data that is monitored and filtered out to identify the data you need to know in that current moment, rather than spending minutes analyzing a player’s graph, etc. It is as simple as typing a name into the search box, and the data you need to know is right in front of you!
However, for the players that cannot afford to use the Subscriber areas, we will show you an example to analyze directly from FUTBIN / FUTWIZ
METHOD 1 – USING FUTBIN / FUTWIZ PLAYER PRICE GRAPHS
For this example, we will be analyzing the fluctuation for Rio Ferdinand using FUTWIZ.
We will be looking to determine the “Low Point“, “High Point“, “Good Buy Price” and the “Good Sell Price“
To do this we will need to search the player on Futbin.com and find the card we are looking to gather Pricing Data for.

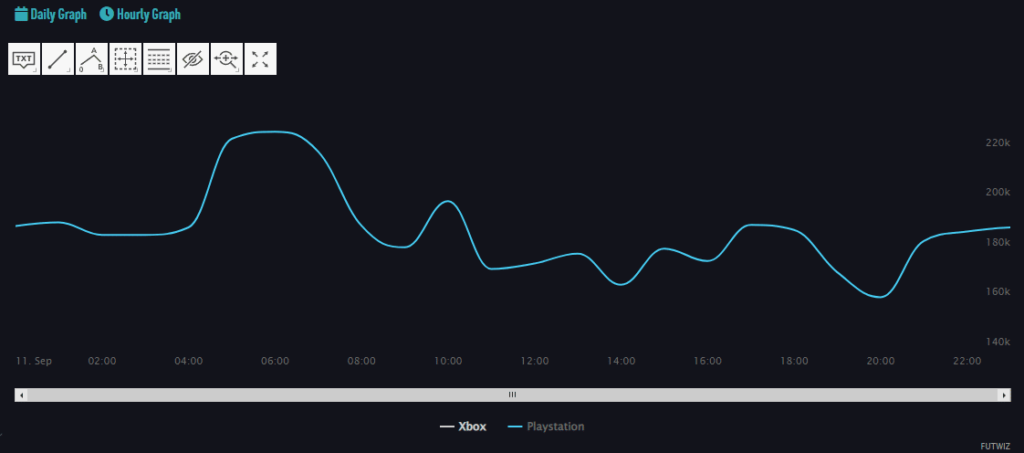
From the Graph image provided, you can: Filter it by Platform. Sort it into either “Daily Graph” or “Hourly Graph.” This information is incredibly useful for tracking a player’s price fluctuations. It allows you to see how the card’s value has changed over a 24-48 hour period.
There are several benefits to using this data:
‣ You can assess whether the card experiences more significant price fluctuations compared to other Icon cards, potentially leading to higher profit potential.
‣ It’s easy to spot a “Good Buy Price” and “Good Sell Price” by analyzing the past 24-hour pricing history on the market.
‣ You can gain a comprehensive understanding of how Icon cards typically behave on a day-to-day basis.
Additionally, you have the option to review the market sales history for each player! (Please note that this feature is available on desktop only through the FUTWIZ website.)

As you can see from this graph, we’ve highlighted the “Low Point” and “High Point,” which are also known as the lowest and highest values on the graph.
‣ Highest value = Aim for a target sell price between the “High Point” and the next 3 highest values from the Hourly graph.
‣ Lowest value = Aim for a target buy price between the “Low Point” and the next 3 lowest values from the Hourly graph.
(Please ensure you calculate the EA Tax on the selling price if you follow this method)
Notice a very ‘common‘ trend in this example from what we explained earlier? The “Low Point” occurred around 20:00pm UK Time, while the “High Point” was around 07:00am UK Time, and again in the late evening.
This means for the best experience in purchasing Icons at good prices, aim to actively look for potential deals between 16:00pm – 20:00pm.
(Remember: Content releases at 18:00pm can affect card values)


Please note: You need to select the sold prices button which applies to your platform underneath the price box on Futwiz.com to view the correct market sales history data (This is vital)
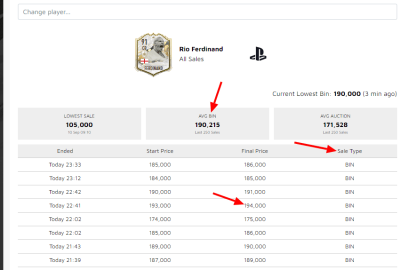
As you can see from this image we can also refer to the “Market Sales History” which can be found inside most player pages on FUTWIZ. With this ability, you can view recent sales that have taken place on Ultimate Team (not all sales are provided just a select amount) This allows you to see whether or not the card receives sales at the “High Points” from the graphs we have analyzed.
As you can see here within a 24 Hour period this card has had a sale at a “Low Point” of 160,000 coins. It has also sold at its “High Point” which was 194,000 coins. This would result in you receiving 184,300 coins after tax. As you see just from this one example buying for 160,000 coins and selling for around 190,000 coins would result in a total profit of 20,500 coins after EA Tax on just one Icon trade. Now imagine doing that with 10, 20, 30, or even more Icons at once! As your coin balance builds the profit expands!
METHOD 2 – USING OUR MULTI-PLATFORM SUBSCRIBER BUYING / SELLING PRICES FOR ICONS
With this method, we handle all the tedious tasks, such as fast-loading player pages and reaction times, so you don’t have to.
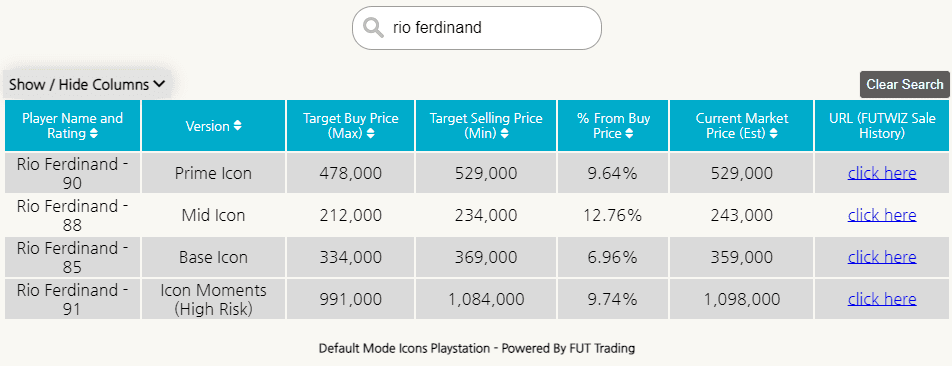
All you need to do is visit our Subscriber Area Icon Prices for your platform. Hover over the ‘Subscriber Areas’ Dropdown menu, search for a player, and you’ll instantly have all the essential data at your fingertips. Finding great deals in the Ultimate Team market has never been easier!


We have 3 unique areas for our Icon Buy & Sell prices:
1. Main Icon area & Platform selected. (Colour coded pages)
2. Daily average Icon area which can be visited from inside the main area.
3. Advanced Icon area which can be visited from inside the main area.
Two of the many benefits of this method that make trading Icons as easy as possible are:
‣ Automatically updated every 10/20 minutes with regular Discord announcements and a “Last updated” menu within each area to keep you in sync with the latest data.
‣ Ability to Sort / Filter the Documents into Low – High and in alphabetical order to group Icons with their alternative versions. You can also find deals like this by referring to the current market price update and cross-referencing it with the (Target Buy Price)
(Please note: Buy Prices in these images are not valid they are examples)